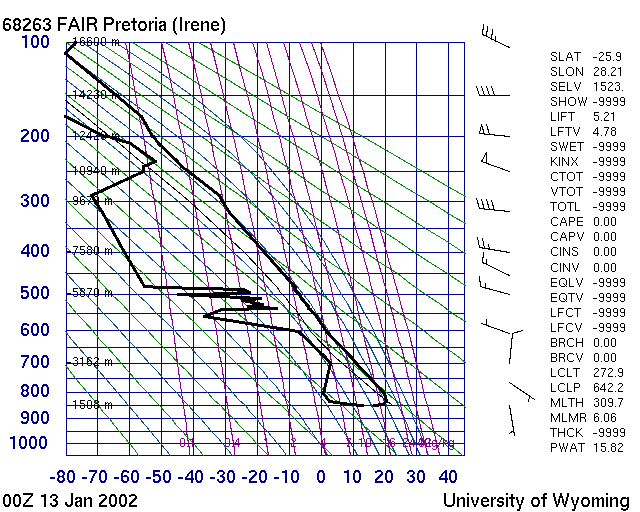
What ???? is this about ???
Idea is to fly high and far. Agreed? No? Go away.... this is not for
you.
Still here? Seems I found a reader who loves to core a thermal and
the sound of a screaming vario.
Temp, Skew and T-Phi allow you to figure out at 8.00 in the morning
if this will be the day to go and fly.
Or decide to fix the garden and take the kids to the Zoo instead of
rushing to take-off and end up in turkey.
Good flying for me means strong thermals taking me all the way to a high cloudbase.
If you see a forecast that reckons that we got a dew point of 20 degree and a maximum temperature of 25 degree, then we can expect a cloudbase of around 500 meters. Not so great.
Ok, this was a bit simplified. In reality the air mixes as it goes up with some of the air around it. But for our flying it is good enough.
The more correct way is to take the spread, which is max temperature - dew point, and multiply it by 122 to get the cloudbase in meters. Or use the factor 400 to get it in feet.
Sometimes at takeoff you might notice while waiting that the zeroed
Altitude on your Vario changes.
Or the next days the zeroed Altitude on the Vario has changed.
This is due to air pressure changes.
If you Vario ALT2 shows 100m altitude gain over an hour, while being
stationary, then watch out for any front arriving with a vengeance.
100m corresponds to a 10 mb pressure drop. Pressure drops are an
indication
of some bad weather and strong winds on their way.
Let's say we got some warmed up air on the ground at high noon.
Ready
to rise and become a thermal.
The air on the ground got warmed up to 30 C, while a few meters higher
up the air is 20 C.
The bubble decides to release and rise up, since it is warmer and
lighter.
Thumbsuck any air parcel what is rising up is cooling down by 1 degree
Celcius per 100 meters.
Now it depends what the surrounding air temperature relative to the
air parcel that is going up.
And for this we need something and someone to measure that for us.
http://weather.uwyo.edu/upperair/sounding.html
And we can download the graphs. The graphs are also called a Temp or
a Balloon Sounding.
And the way the Temp gets drawn is either as a SkewT or a Stueve
Diagram.
T-Phi comes from plotting the Temperature T , and phi, what stands
for entropy, or how much energy is in the air.
And here we finally got an example of what a Temp diagram can look like.

Horizontal lines is altitude , same as air pressure. We tend to fly
up to around 3000 to 4000 meters.
Means only the part from the bottom 1000 mb to 700 mb pressure is of
interest for us.
All the stuff above 700 we can ignore.
The blue numbers at the bottom with the blue lines going up vertical is temperature. ( This is a Stueve diagram)
Green curves are the dry adiabats. A warmed up air mass follows
those
green curves.
The blue curves are wet adiabats, what happens when you air condensates
and makes a thunderstorm.
The purple curves are called the saturation mixing rate.
The left curve is the dew point. The right curve is the temperature of the air.
Another URL where you can get sounding data is from
http://www.weathersa.co.za/glider/Skewt.gif
at the SAWB Aerosport Web Site
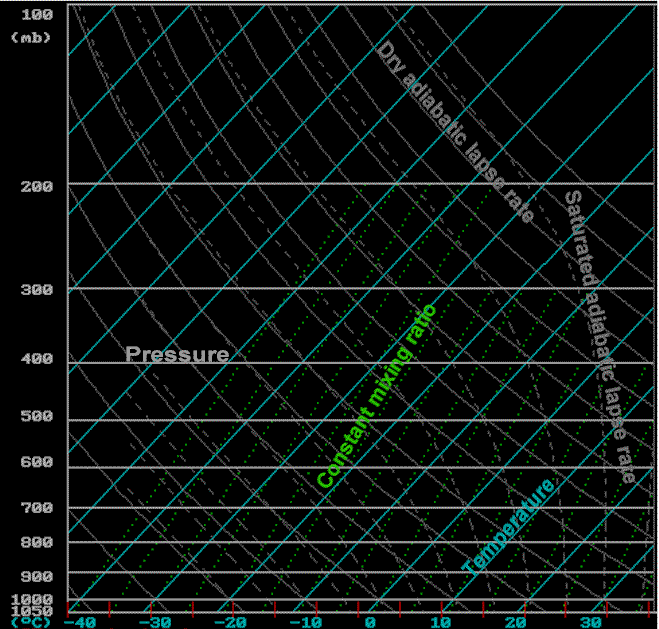
For this you have to download the RAOB program to view the graph.
The bottom line shows in those blue numbers the temperature.
With the blue lines running sort of diagonal across. We got a skew
Temperature diagram here.
The vertical bar, on the left side, in white grey numbers, shows the
airpressure.
Airpressure at sea level is around 1013 mb, and it gets less as we
go up.
So you are one of the lucky ones who lives close to a weather
station
that sends up a balloon to collect sounding data.
Use the closest weather station sounding to your flying site. For
Gauteng
this is FAIR.
Download from the web at http://home.att.net/~doug.kathy/Soarcast/Download.htm
the Soarcast program. It will tell you if it will be a good day
and
give you the expected thermal strength. In knots! Just divide the value
by 2. 5kts is 2.5 m/s. Feed Soarcast with the text data from the
Wyoming sounding. Use MS Internet Exporer IE5 and save the text data of
the sounding as a whatever.txt file. Then use Soarcast to open your
saved
file.
Here is an empty Stueve and empty SkewT diagram as it used by the
Wyoming sounding website.
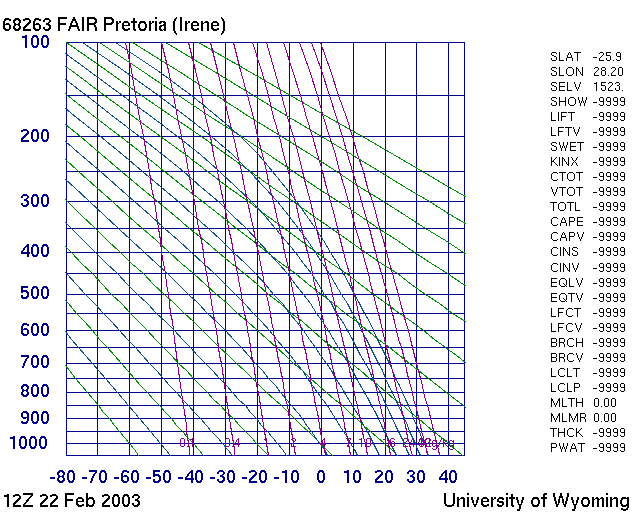
The bottom numbers are temperature.
On the vertical is height or pressure , same as altitude .
Left curve shows the dew point .
Right curve shows the temperature as the balloon went up.
Temperature is vertical blue lines.
Dry adiabats are the green curves.
A good XC 100 km day in the Stuve ( Stueve) diagram format

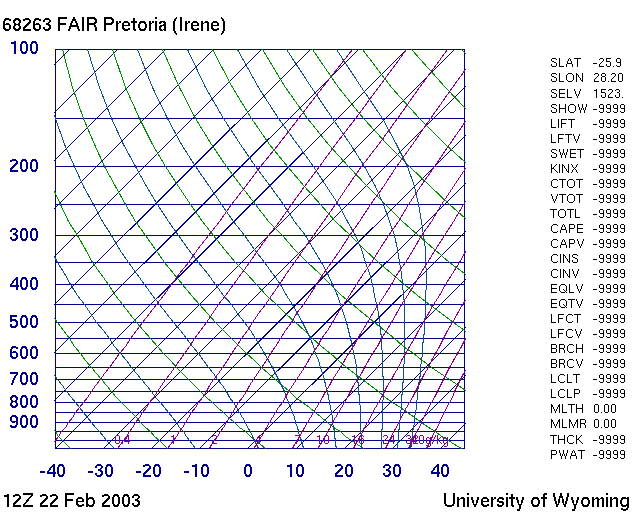
Again the dew point is the left curve.
And the right curve is the temperature of the air as we go up..
Temperature figures in blue at the bottom. Slanting up towards the right
Dry Adiabat and Isotherm curves intersect under a 90 degree angle in a Skew T.
SkewT are the preferred way for thermal hunters to see if it will be
a good day.
We need a good lapse rate and what it does as we go up. And a Skew
T shows variation in lapse rate more obvious.
More info on Skew-T see http://meteora.ucsd.edu/weather/cdf/text/how_to_read_skewt.html
A good day will have a Zig Zag temperature curve.
And dry air higher up. dry air means dew point goes to a very low
number.
Zig, means a low inversion, but not very strong.
No inversion on the ground becomes a bubble day. The moment the air
warms up a little it shoots up.
We need something to hold down the air on the ground for a little while
to build up some real hot big bubble of air.
That big bubble will finally break through the inversion and gives
a big nice thermal.
Once through the inversion, we want the surrounding air to cool down
a lot, so that our thermal always stays a lot warmer
( in real life that is only 1 to 2 degrees ) so that it will take us
up higher and higher.
But once the thermal air cools down to dew point and we start getting
the cloud then we need an upper inversion. The Zag part.
If there is no second inversion, and the thermal is now condensating
and becoming a cloud and is still warmer to the surrounding
air,
then it will keep on going up.
In fact now we cool down a lot less then before. Thankx to the vapor
releasing heat.
2 possibilities. Either surrounding air is very dry , then there
is a chance that the thermal will mix as it goes up and dry itself out
and the cloud
will dissipate as it goes up.
Or the air is also humid higher up, then we get an Anvil and a
thunderstorm.
If we have a Zag, a strong high inversion, if possible at 4000m ,
then
we have a super day.
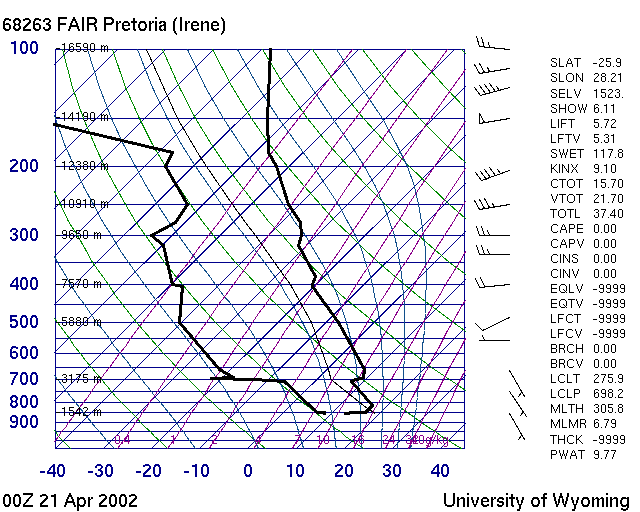
Above is an example where a pilot flew 70 km from Rustenburg.
Upper wind is west, what is good for Rustenburg, with the takeoff
facing
East or West.
One can assume that the upper wind will during the day also determine
the lower wind direction.
There is an inversion, which will require about 20 Degree to break
through.
Where does he get that 20 from?
We look at the right curve.
It start of at a horizontal line 850 mb, or it says there
1542 meters. That is the ground.
Temperature on the ground is around 13 C , in between the 10
and 20 blue skew line.
That black curve goes to the right as you go up a few meters.
Then turns around and heads to the left.
That is around 810 mb pressure level, 40 mb up, around
400 meters above ground.
And the temperature is 18 C.
We got an inversion around 400 meters above ground.
Now we invent a green curve that runs through that inversion
tip , sort of parallel to those green curves.
This green dry adiabat will intersect the ground line
at around a temperature of 21 C
As the day progresses and the air gets warmed up thermals will
start breaking through the inversion from 21 degree onwards.
In April one can expect around 25 degree max.
Find 25 C on the ground and put a green curve through it.The diagram
got one roughly there.
That green curve a warmed up air parcel will coold down as it
goes up.
Once it reaches the temperature of the surrounding air the
thermal
is finished.
Which appens here at the 700 mb pressure level, or 3175 meters
ASL.
The dew point curve, the left one, is going more and more to
the
left.
Means the dew point is getting lower as we go up.
Upper air is very dry, no risk of thunderstorms.
Any condensation will be gobbled up by the dry surrounding upper
air
And below is the sounding at 14.00 local time.
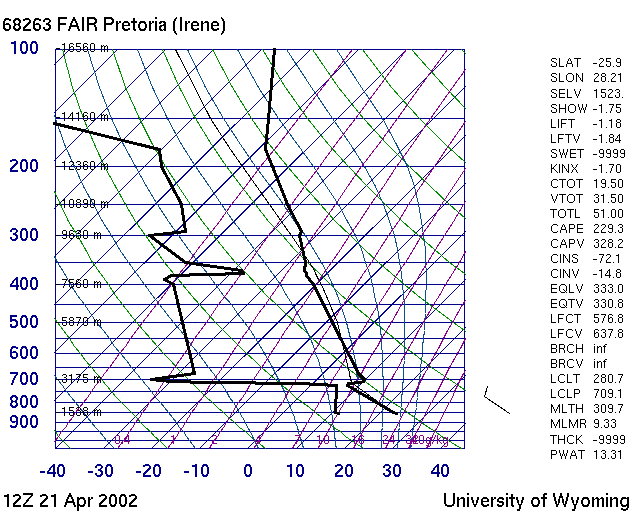
The temperature curve is leaning away from the green dry adiabat.
Indicating some very good lift.
Maximum temperature worked out better than expected, was in fact more
like 28.
At this day we had light wind conditions. Took off West in
Rustenburg,
and the thermals were anything from 1 to 4 m/s max.
And up to 2100m ATO. Working until 16.30.
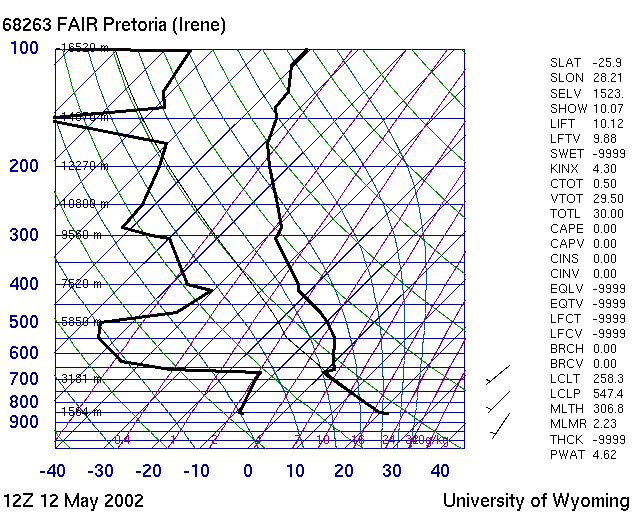
At 12.00 Zulu, or 14.00 local time, the temp shows a straight dry
adiabatic
temperature drop as on goes up.
At the ground we got around 13-24 degree, cooling of very quick to
20. Any air bubble that gets triggered and is more than 20 will keep on
rising until around 3500m.
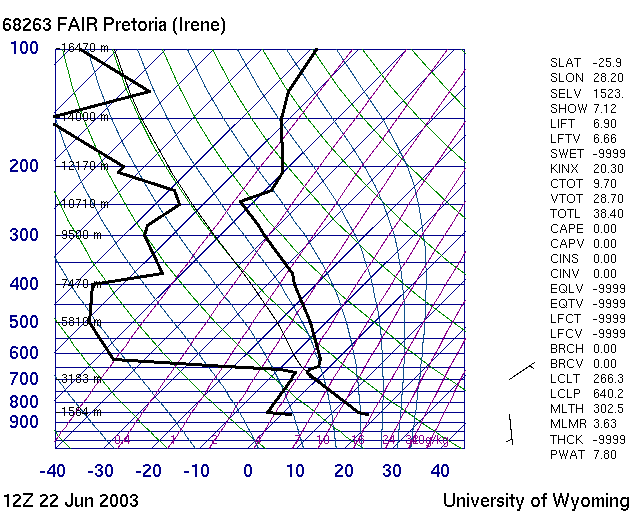
Here is another example of a very cold day in the high feld after a
cold front passed through.
With -2 degree in the morning one does not expect a good day.
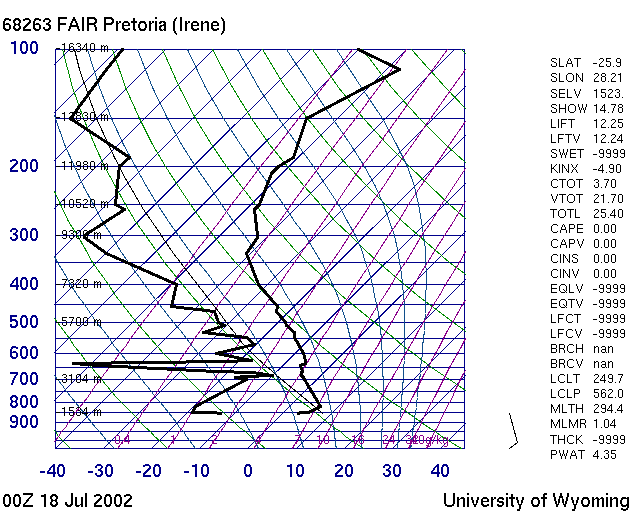
By 11.00 the cumulus clouds were popping.
Soarcast, with a max temperature of only 13 degree, gave 7 m/s
thermals.
Even in winter, on one of the coldest days of the year, one can get
good flying if the air is right.
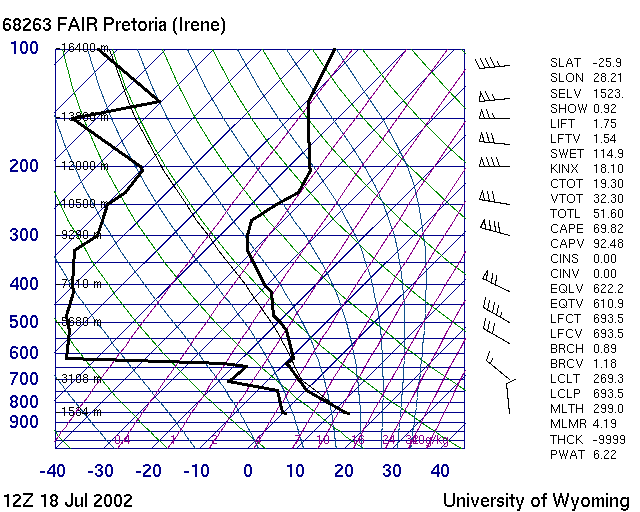
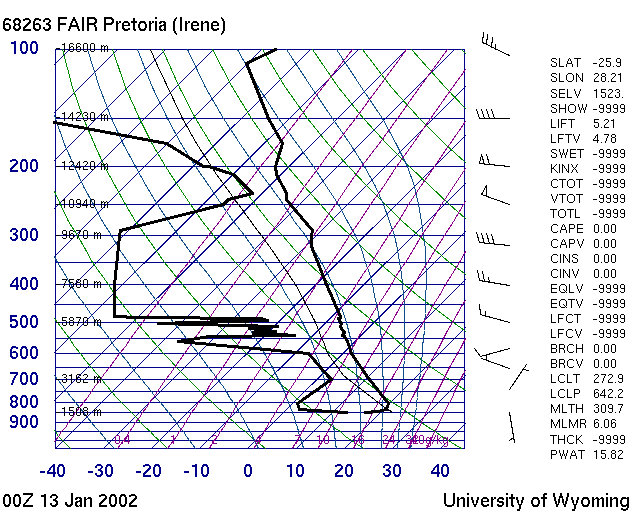
The temperature curve is leaning to the left. You can see the thin
curve
above it, indicating the temperature of a rising airparcel. The
temperature
is cooling down faster as a warmed up air parcel would. at the 750
pressure
level condensation will happen and clouds will start.
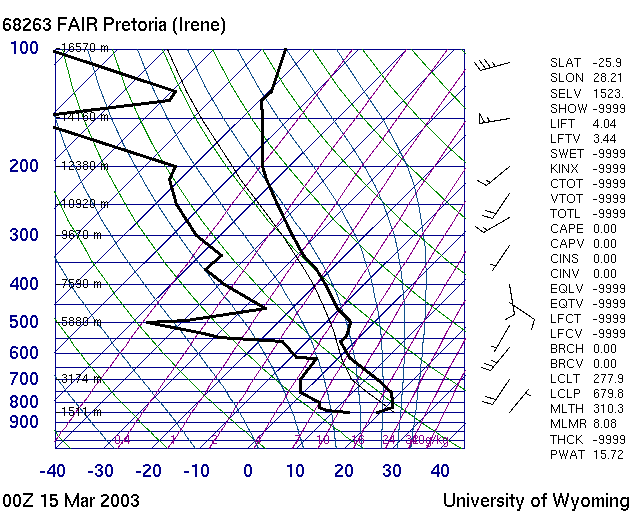
SHOW and KINX do not indicate any overdevelopment.
LIFT and LIFT with 3-4 indicate good thermal activity.
Maximum Temperature for the day was around 30 to be expected.
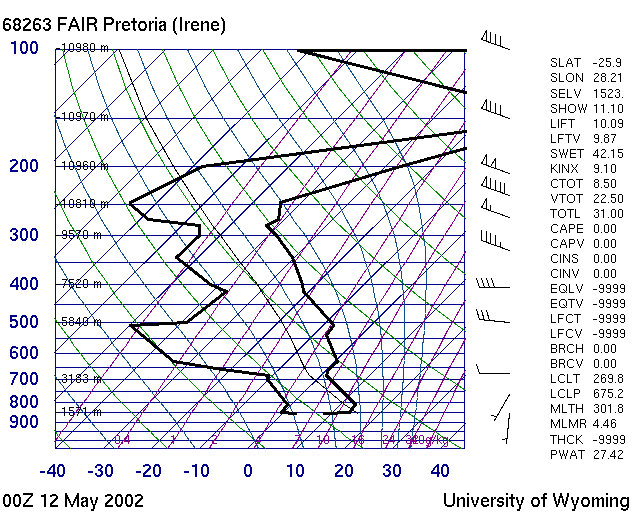
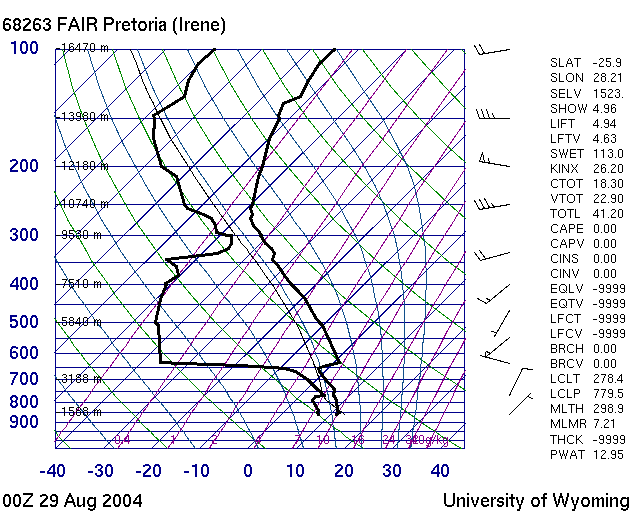
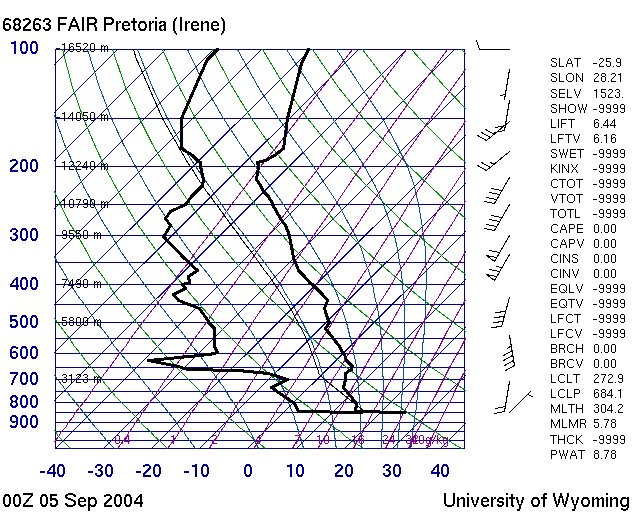
A Southerly day at The Dam where pilots flew 170 km, 150 km and 100
km.
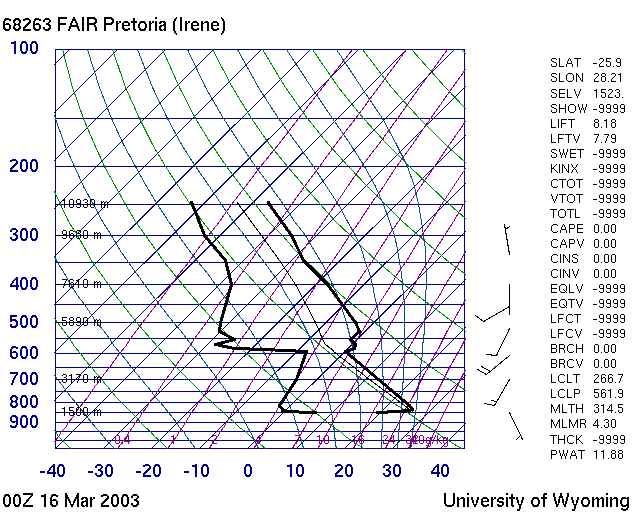
A 100 km and 60 km flight from Dunnottar.

A 7m/s max up day, cloudstreets , from Dunnottar in winter
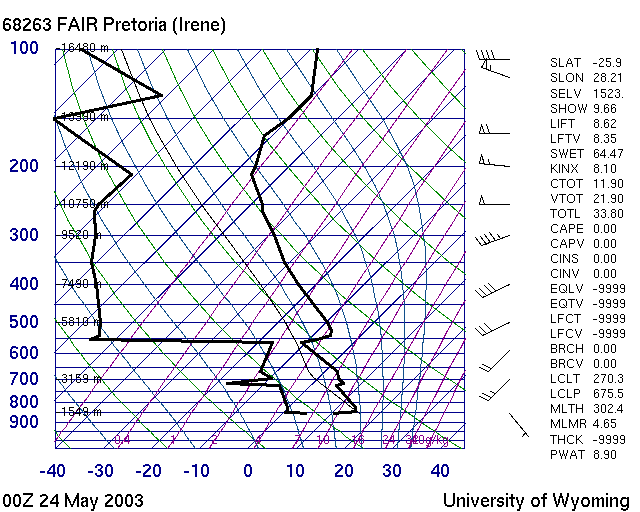
Weatherforecast predicted trough conditions, air mass changed from
the
South in the early morning
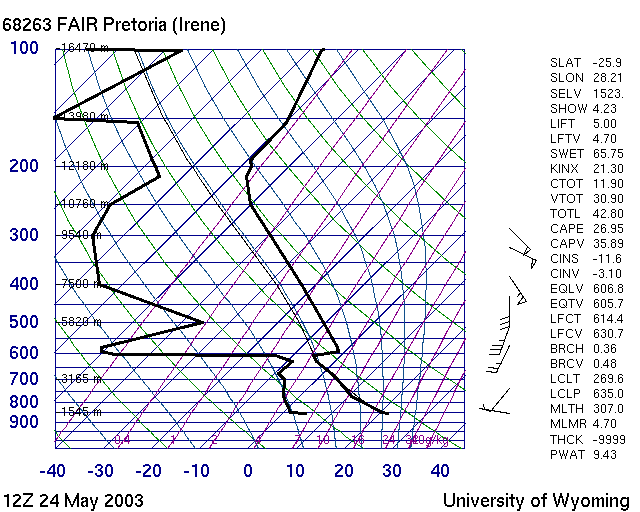
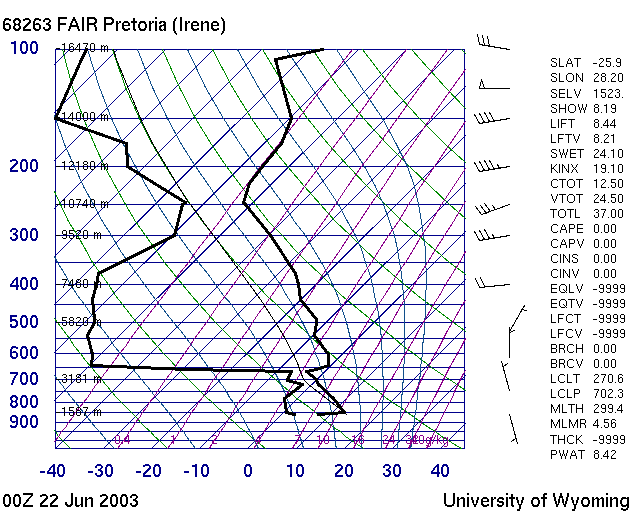

This day produced early thuderstorm in Dunottar.
Weak lift in rustenburg area.
But once the gustfront reached the Dam easy XC towards Garankuwa
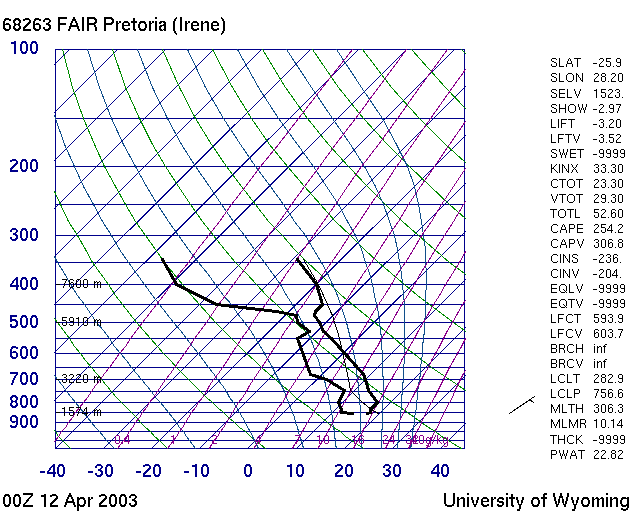
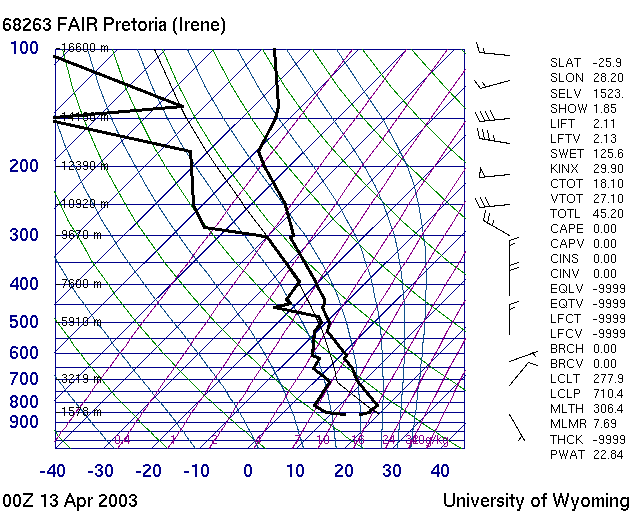
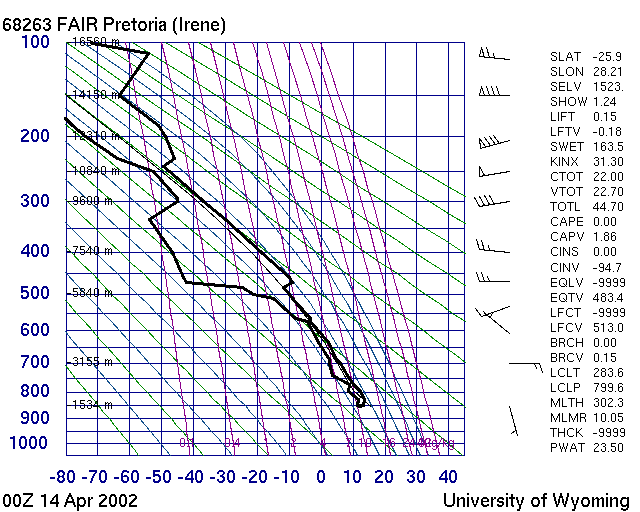
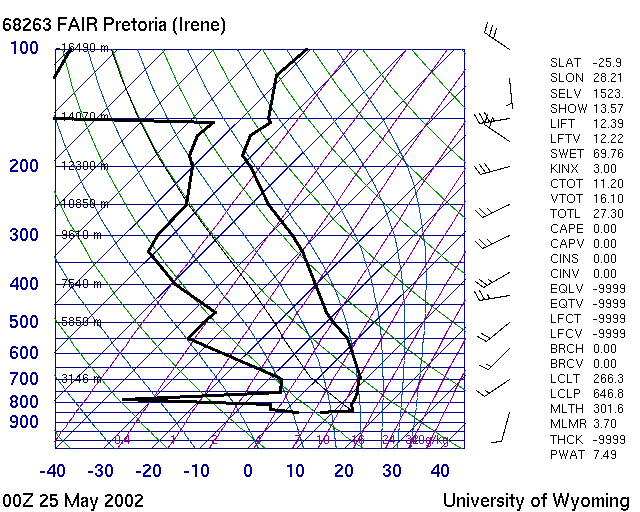
No chance for any warmed up air to get very high
For good flying, we need a strong inversion at condesation level to
stop any overdevelopment.
Or lots of dry air above the codensation level to gobble up the humid
air.
If the KINX is 30 or more than one can expect a thunderstorm, overdevelopment later in the day.
See http://www.soar-high.com/charlie/SoaringIndex.html for LIFT, THERMAL, K and SHOWALTER Index
Also a good link is
http://www.chebucto.ns.ca/Recreation/BSC/weather.html
which gives us this table
| Lift Index < 0 | Lift Index > 0 | |
|---|---|---|
| K Large > 10 | Wet and Very Unstable
Thunderstorms Possible |
Stratified Clouds
Precipitation |
| K Small > 0
or < 0 |
Scattered CU's
Perhaps clear - good lift Good Soaring |
dry - stable air
fair weather blue - some lift |
For Wyoming Skew T diagrams see http://weather.uwyo.edu/upperair/indices.html for some short explainations.
Now, is that info really working?
Lets list some of the good days from above versus bad days
| SHOW | CAPE | KINX | LIFT | good/bad |
| -9999 | -9999 | 4-5 | very good XC | |
| 6 | 9 | 5-6 | good XC | |
| 11 | 9 | 9-10 | good thermal day, no XC | |
| -9999 | -9999 | 3-4 | very good XC | |
| 1 | 31 | 0 | wet, early thunderstorm day | |
| 13 | 3 | 12 | stable | |
| -9999 | -9999 | 4 | 60km+100 km from Dunnottar | |
| -9999 | -9999 | 8 | 170,150,100km from The Dam | |
| -2.9 | 254 | 33 | -3.2 | early healthy clouds growing fast, and disappearing again, then regrowing, finally thunderstorms late, weak lift |
| 1.85 | 0 | 29.9 | 2.11 | early low clouds, looked like they overdevelop but nothing happened on overdevelopment |
K Index around 30 gives a thunderstorm in the afternoon.
When I look at SA values and conditions I would say ...
| Lift Index < 10 | Lift Index > 10 | |
|---|---|---|
| K > 10 | Thunderstorms | |
| K <10 | good XC | poor in summer,
good in winter? |
A MS Powerpoint presentation on this topic
For more info on flying Paragliders in South Africa visit http://www.funwings.com
Prepared and maintained by Ulf Arndt, Copyright Ulf Arndt 2004